Oliver Baldwin Edwards

Hi! My name is Oliver and I'm a Software Engineer at Spatial Informatics Group. I'm a recent graduate of Amherst College where I double majored in Computer Science and Statistics. I'm especially interested in evolutionary computation, machine learning, and natural language processing. Outside of that, I enjoy photography, playing the piano, and rock climbing.
View My LinkedIn Profile
Oliver’s Portfolio
Welcome to my portfolio! Click the name of a project to see its corresponding GitHub page, website, or pdf (when applicable).
Technical Projects

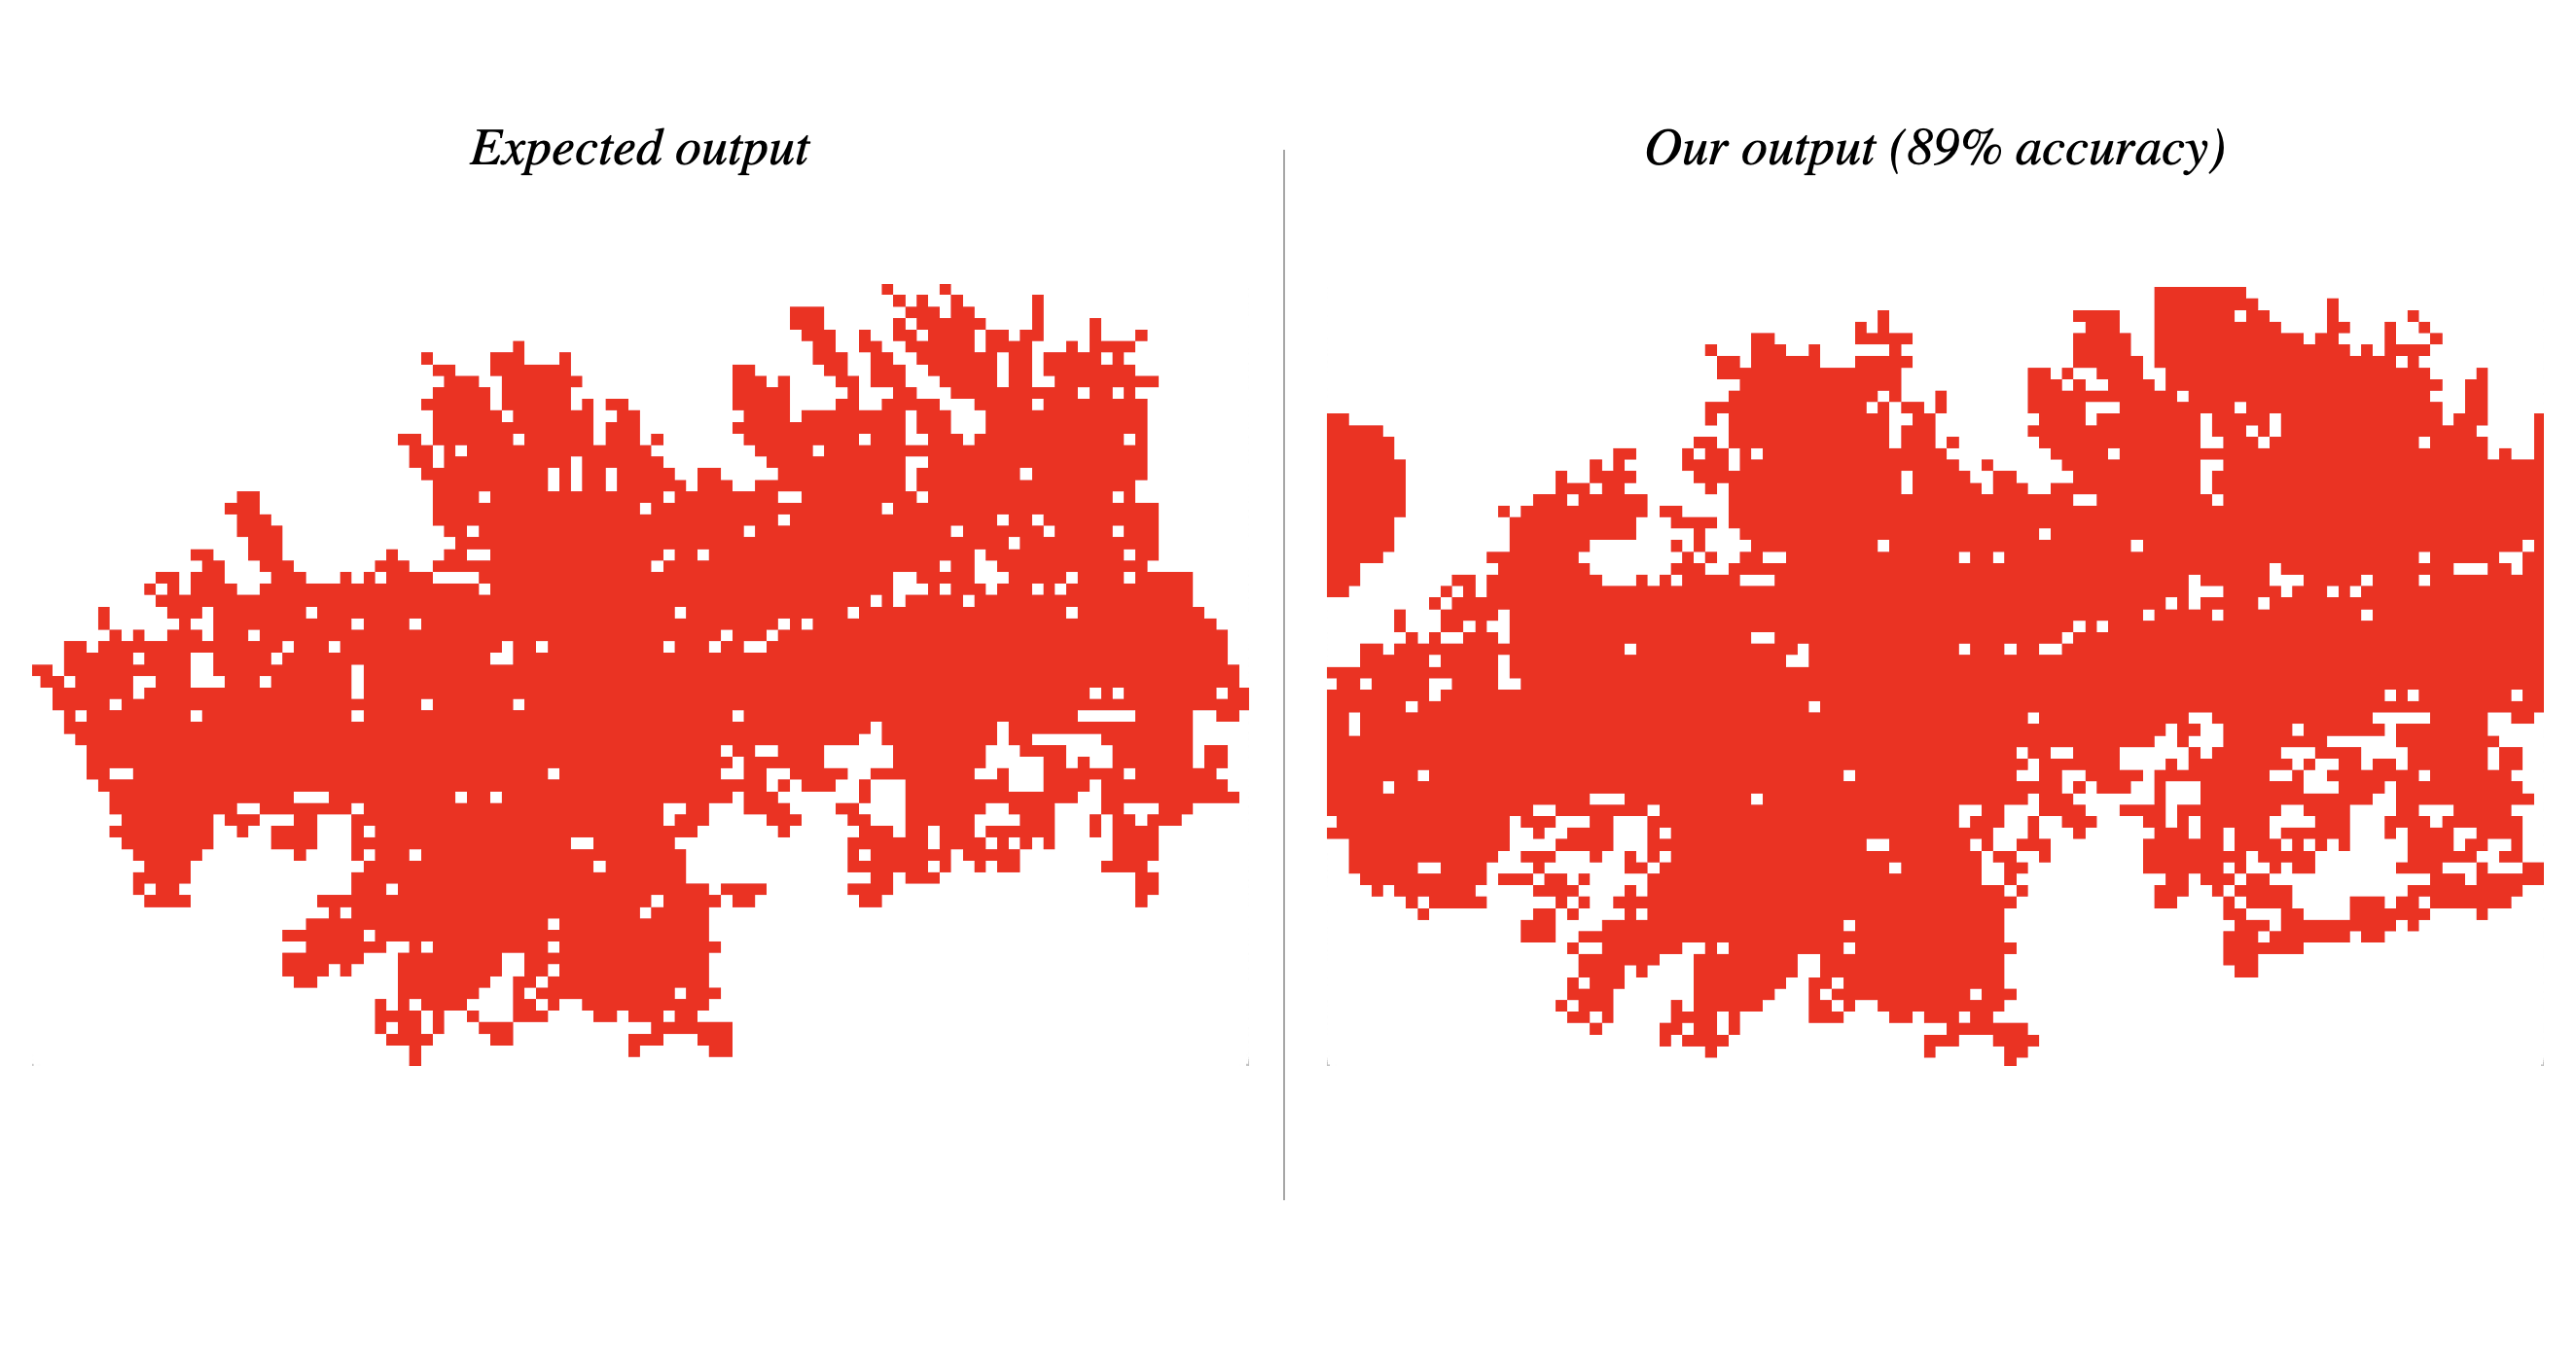
Ring of Fire: Evolving a Wildfire Simulator using Genetic Programming
A parallelized Genetic Program for evolving rules to describe a cellular automaton based wildfire simulation with an error function based on data from Canadian wildfires. Both the genetic program and the wildfire simulator were written in Clojure by @icaruso21, @MGlusker, and myself.
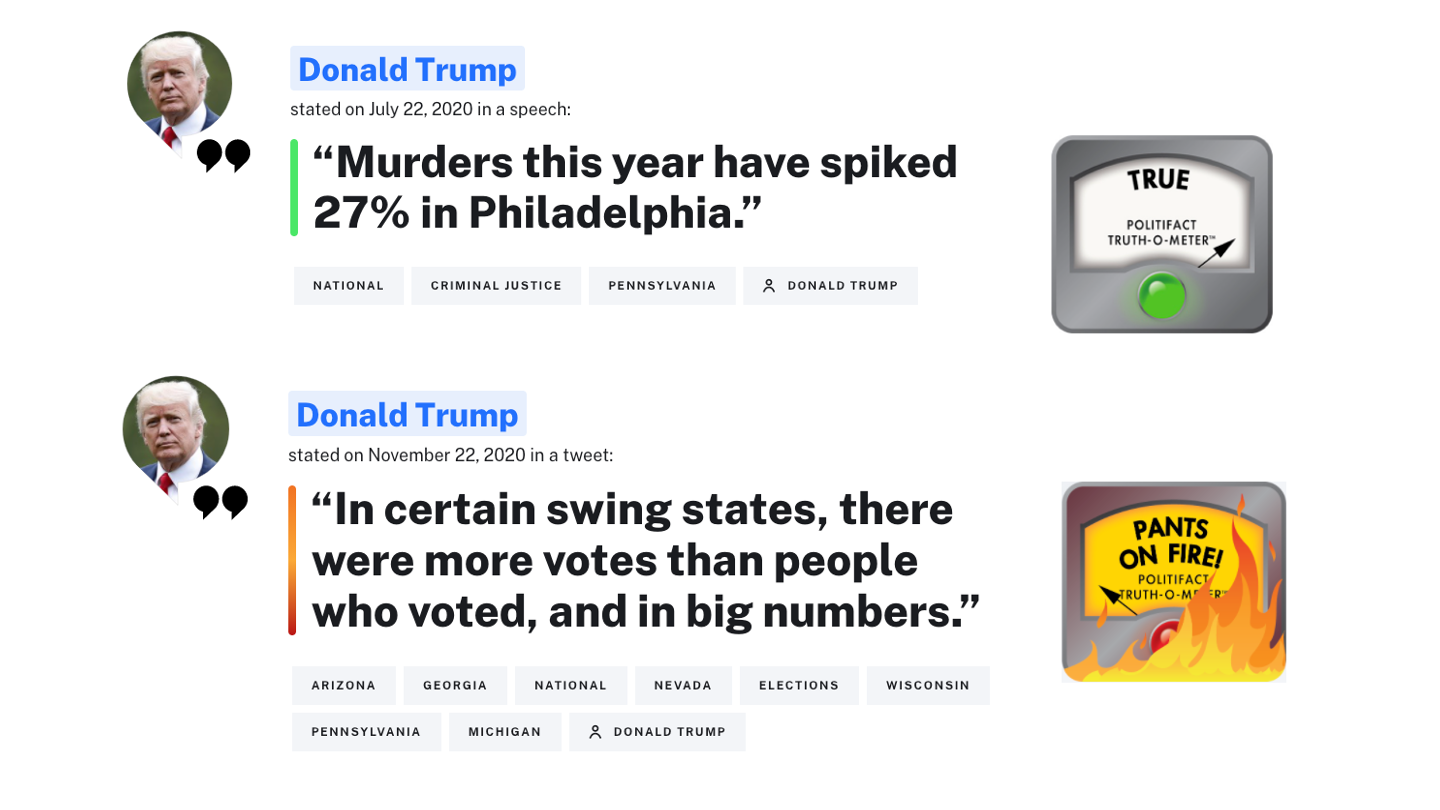
Classifying Fake News Using NLP and ML Website | PDF
A formal report written in R that uses Natural Language Processing and Machine Learning to classify news article claims as either true or false.
This project used a dataset of 1,911 unique PolitiFact claims and their associated truth ratings. Features were extracted from each claim using a bag-of-n-grams model with tf-idf as the scoring metric (the vocabulary size was first reduced using using lemmatization and stop word removal among other text cleaning procedures).
Seven machine learning classification models (including a random forest, a multilayer perceptron, and a recurrent neural network) were fit and a maximum classification accuracy of 71% was achieved.
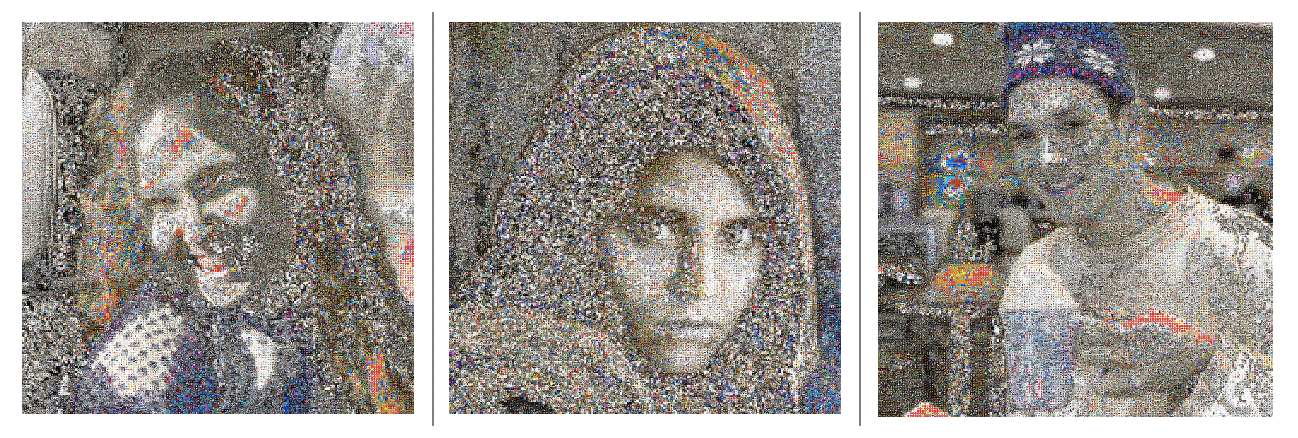
Intellage: An Intelligent Photo Collage Creator
Written entirely from scratch in Java by @icaruso21 and myself, Intellage recreates a desired photo from a user-specified collection of .jpg images. Intellage was used as an exemplar of a final project in subsequent semesters of the introductory computer science class for which it was written.
The following outputs from Intellage each utilized an input folder containing 26,000 stock images:
Various Pacman Artificial Intelligence Projects
Using Python, @MGlusker and I implemented various Artificial Intelligence algorithms in a Pacman setting including:
- Exact inference and particle filtering to read noisy data using Bayes’ Nets
- Reinforcement learning algorithms such as Temporal Difference Q-learning
- DFS, BFS, UCS, and A* to find food pellets
We also created a team of agents to play a capture the flag version of Python. We used particle filtering to estimate the position of enemy Pacman agents, a minimax algorithm with alpha-beta pruning to select our agents’ next move, and different evaluation functions for offensive/defensive moves.
Data Visualizations
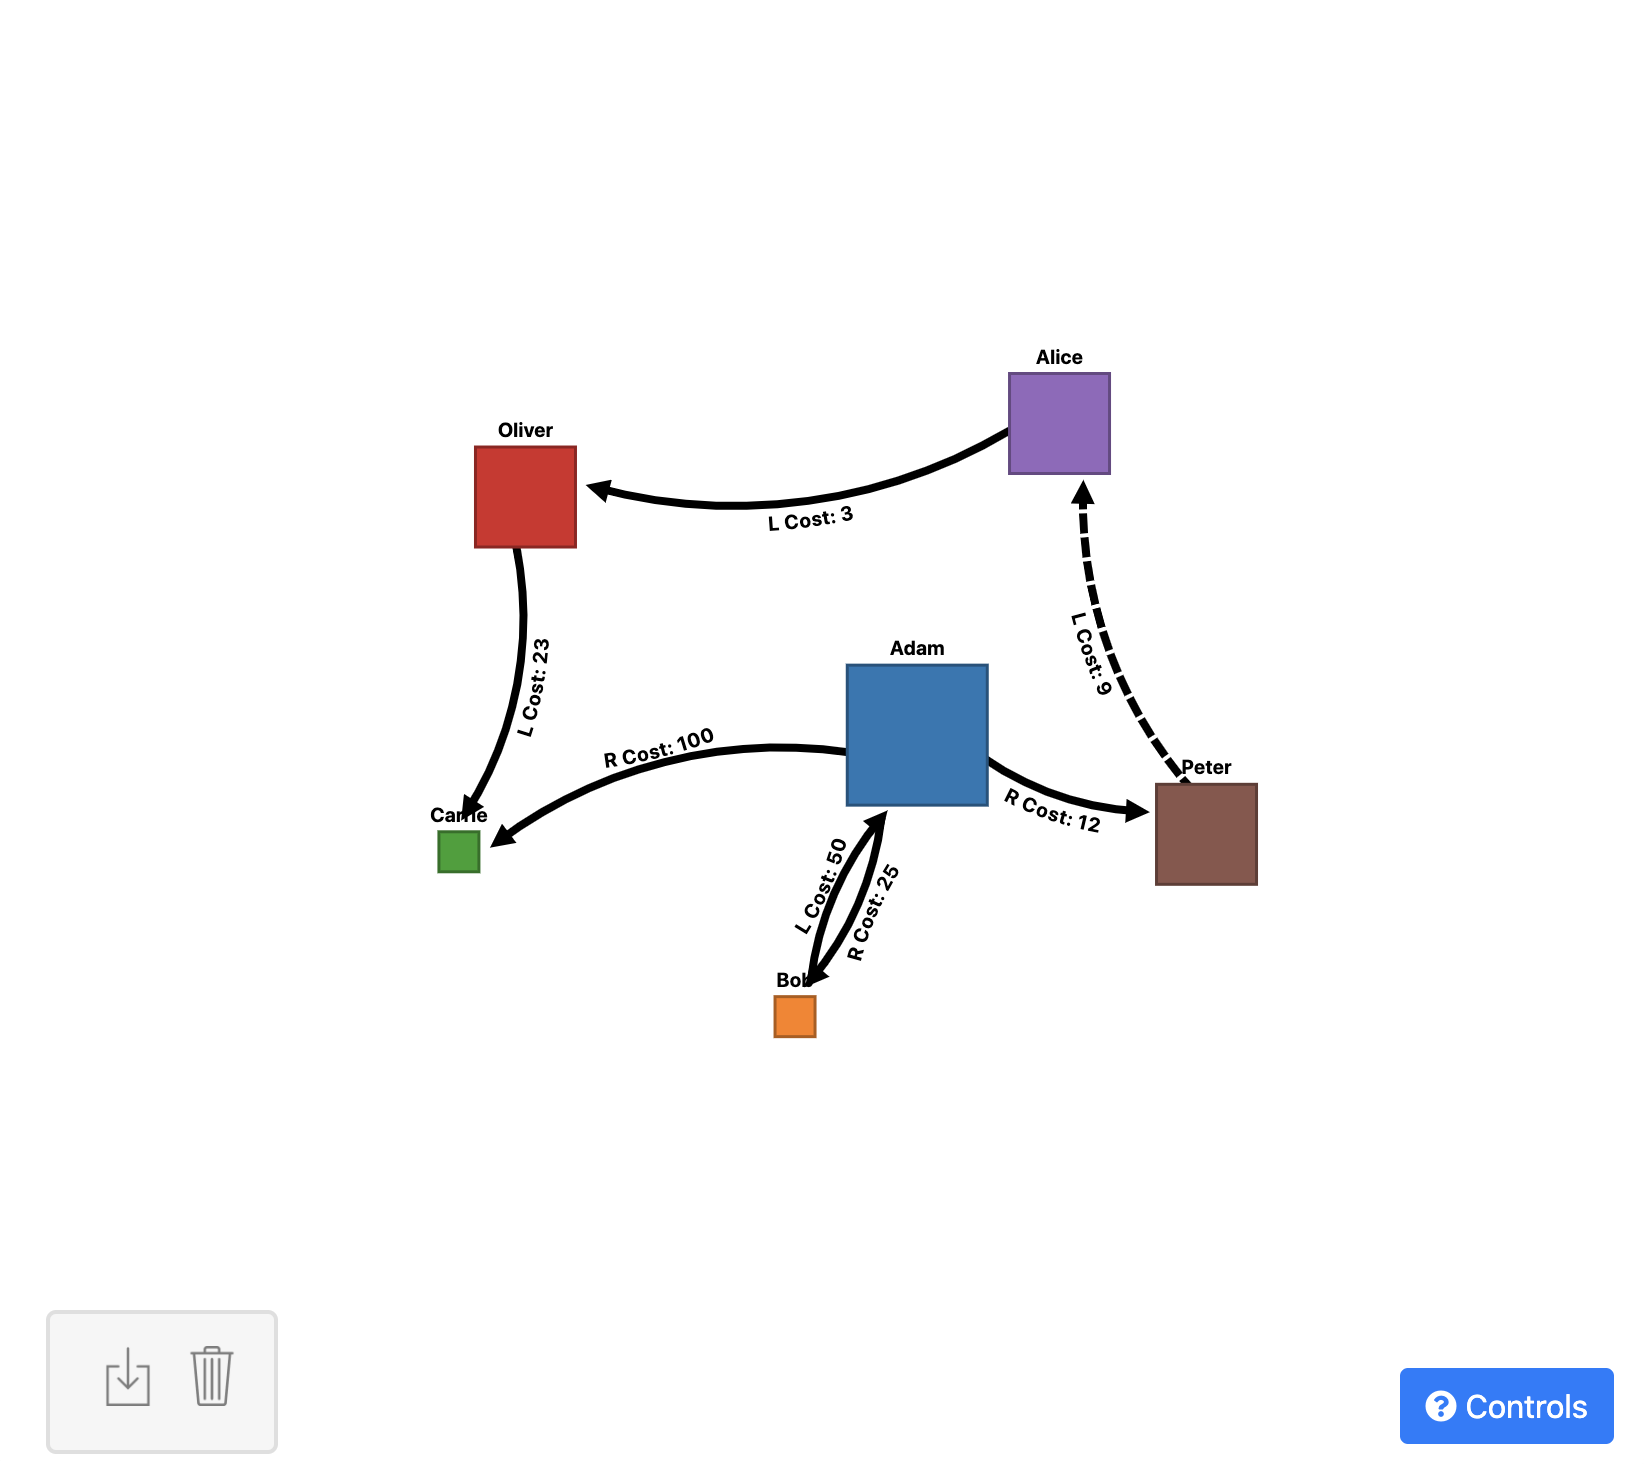
Interactive Directed Graph Creator
A fully interactive web app for creating directed graphs using D3.js’s force layout with the ability to save a snapshot of the graph’s layout as a JSON file for future use. This was built as a prototype for a state chart as part of the work I did as a research assistant for the Tulane Visualization and Graphics Group during the summer of 2019.
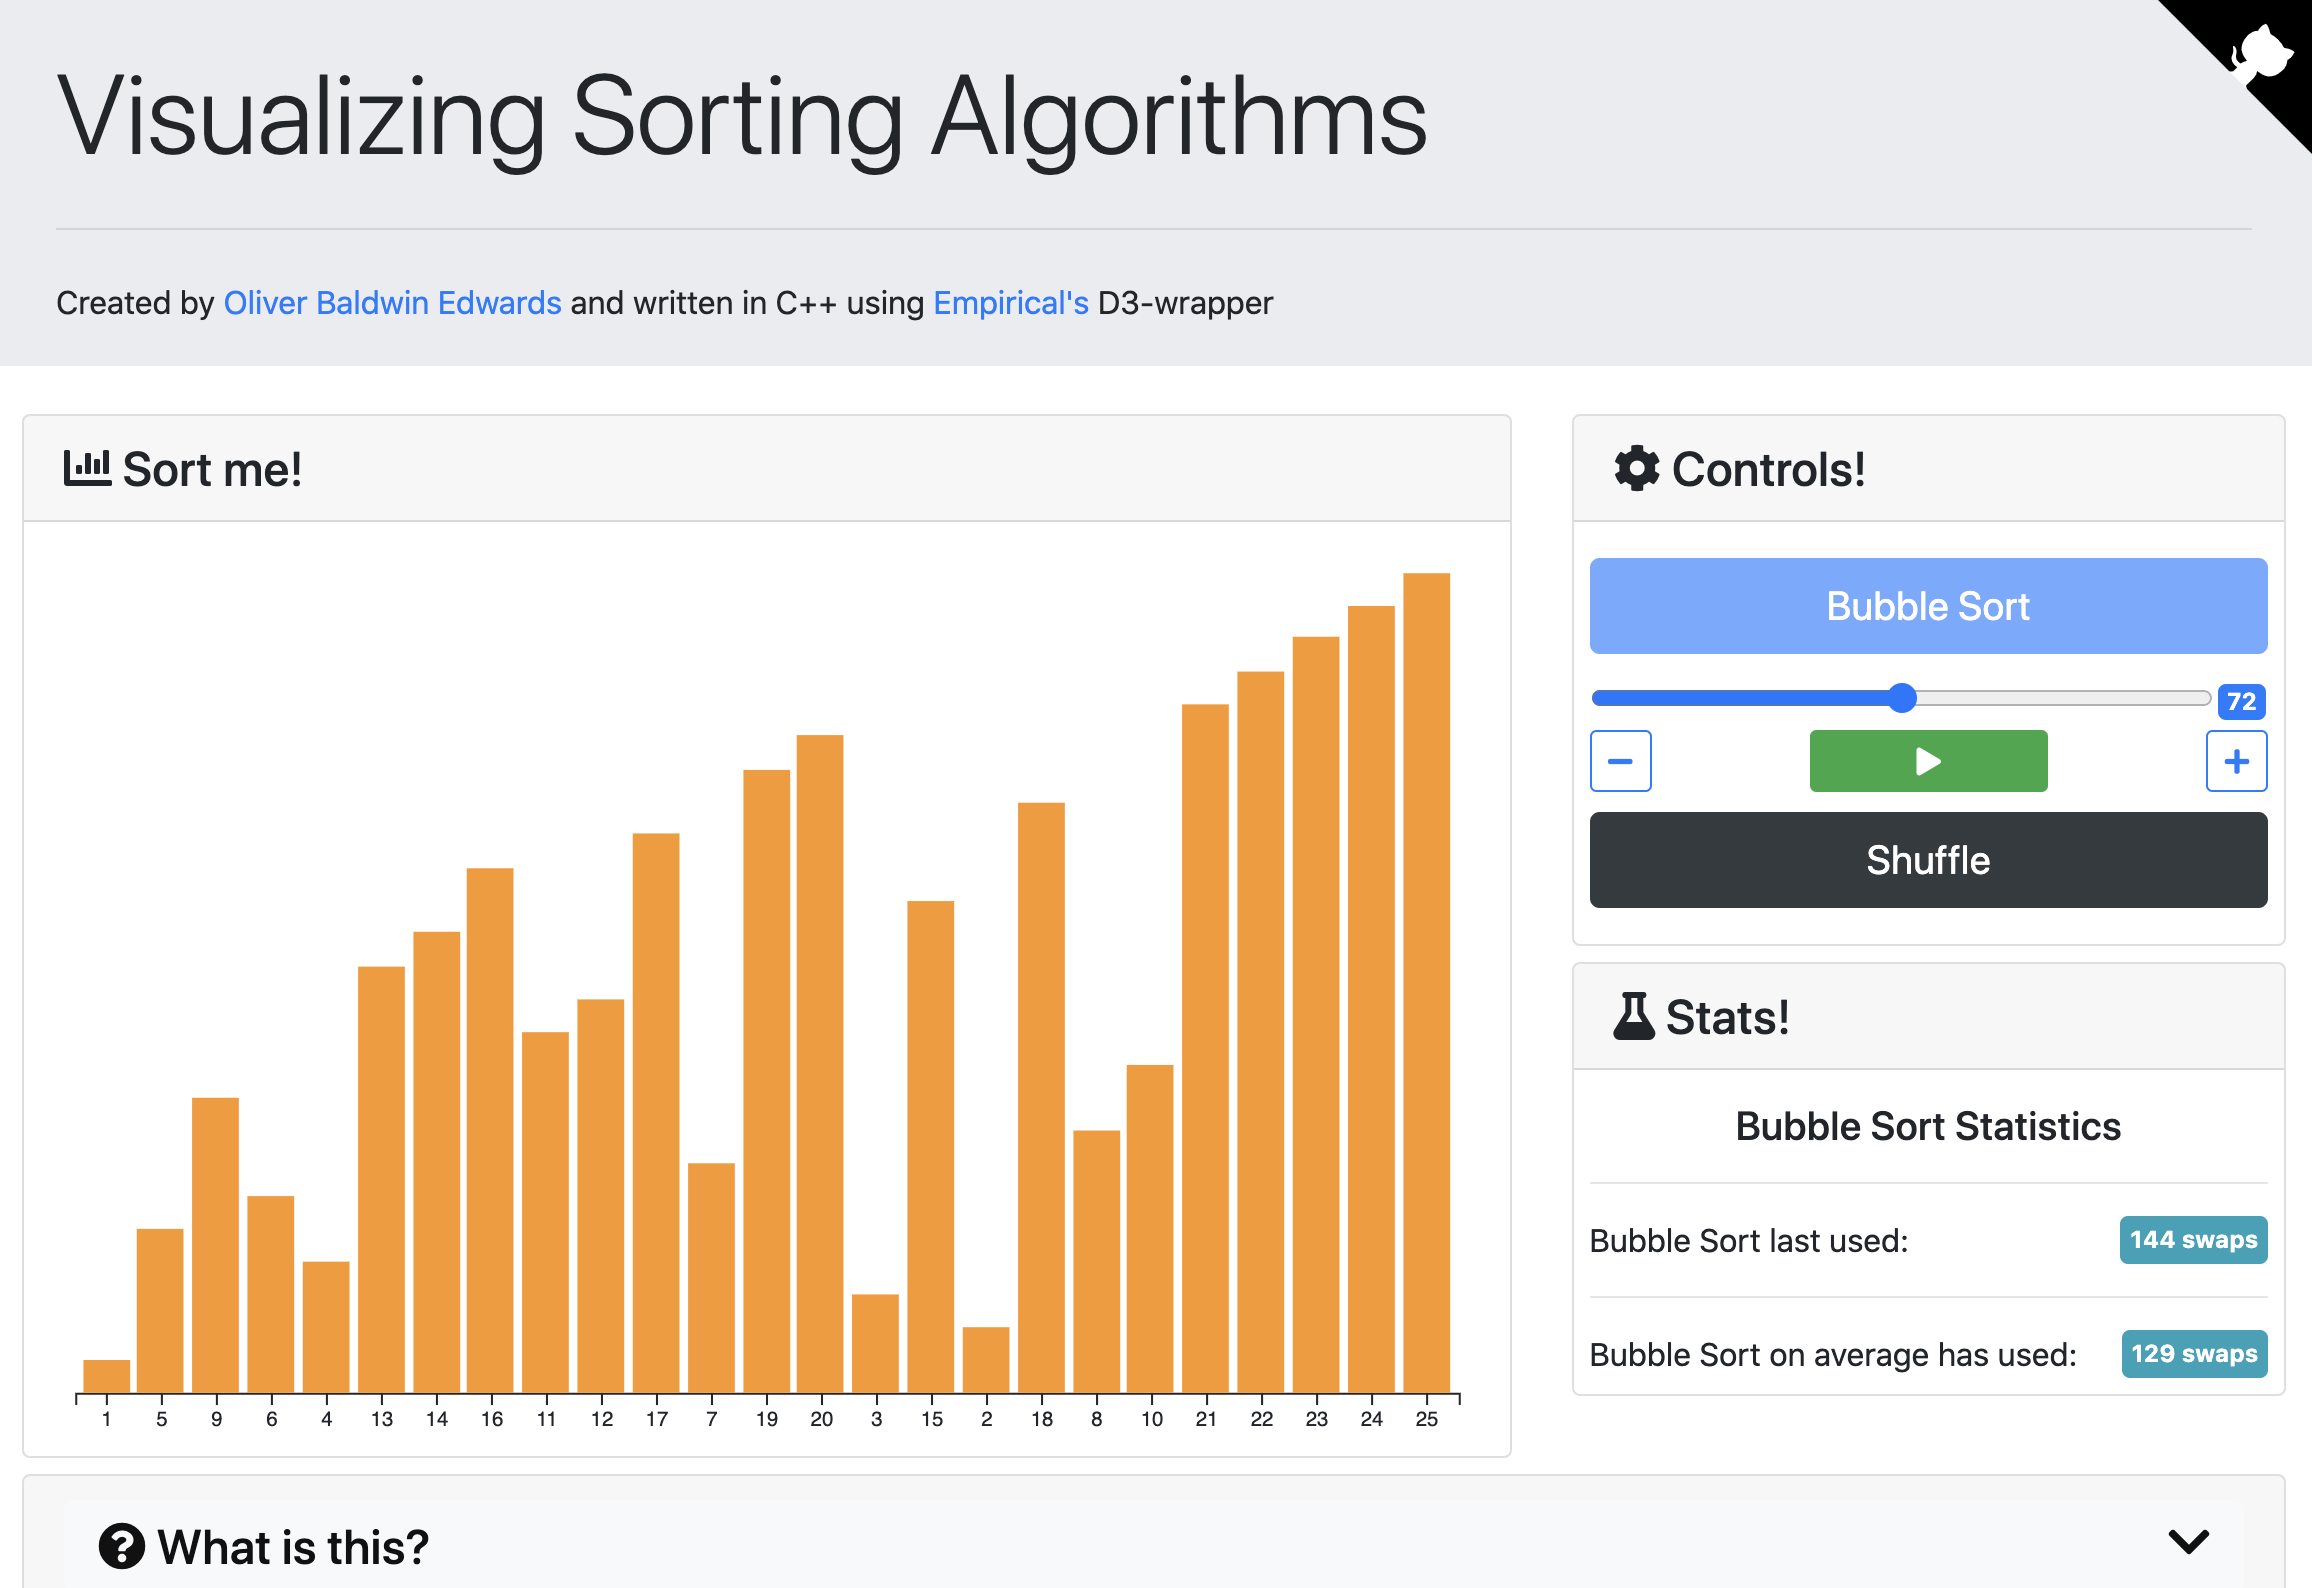
Visualizing Sorting Algorithms using Empirical
A web app written entirely in C++ that utilizes the Empirical D3-wrapper that I helped to write as a Summer 2020 WAVES participant. This project is meant to serve as a demo for how the new D3-wrapper can be used with Empirical (a library for building web interfaces with C++ and Emscripten) to create powerful web apps.
Along with @elizabethcarney, @amlalejini, and @emilydolson I spent the summer creating a C++ wrapper for D3.js, a JavaScript library that allows for custom-made, interactive visualizations. We began the process of overhauling Empirical’s web visualization support for use in the next version of Avida-ED (an award-winning piece of digital evolution education software).
For more information on what I did, see this blog post I wrote.
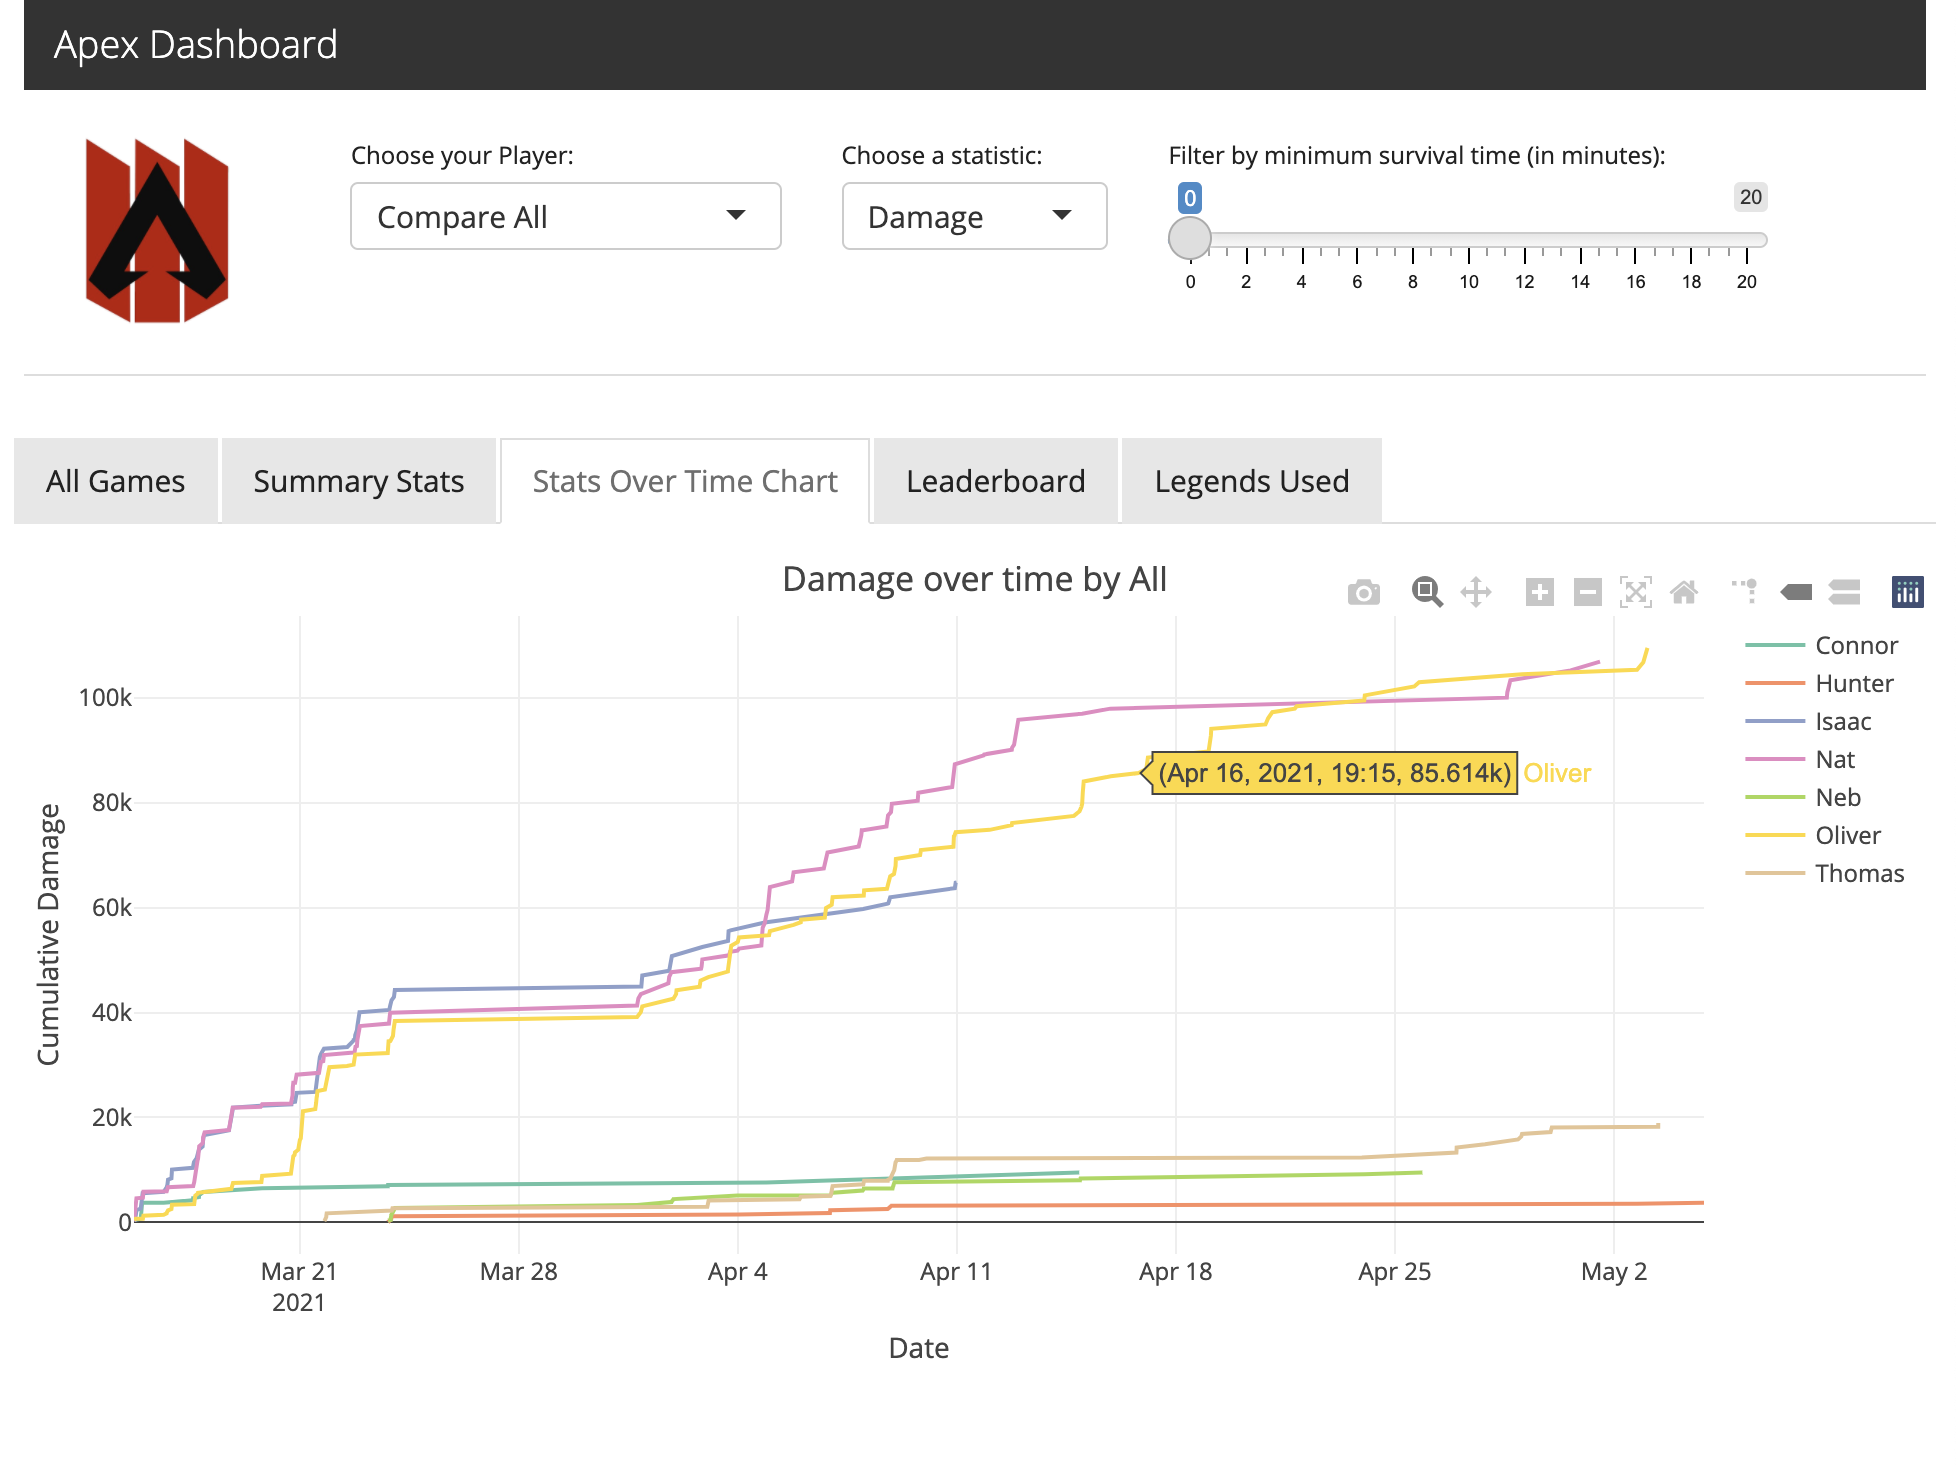
Apex Dashboard
An interactive R Shiny app to keep track of and visualize statistics from the popular video game Apex Legends. A player inputs their stats from a game into a Google Form which then (in-real time) updates the dashboard. The dashboard is hosted on AWS with Docker.
COVID-19 D3 Visualization
An interactive visualization of COVID-19 data obtained from the New York Times built from scratch using D3.js. Note that this is still a work in progress and is very rough and buggy!
Smaller Assorted Projects
Public Transit in US Cities
An exploration of predicting GDP per capita from transit statistics using an aggregation of 30+ datasets and regression trees in R. Built a Shiny app with Leaflet to display transportation stats for 50 largest US cities, created an R Package to contain data.
![]()
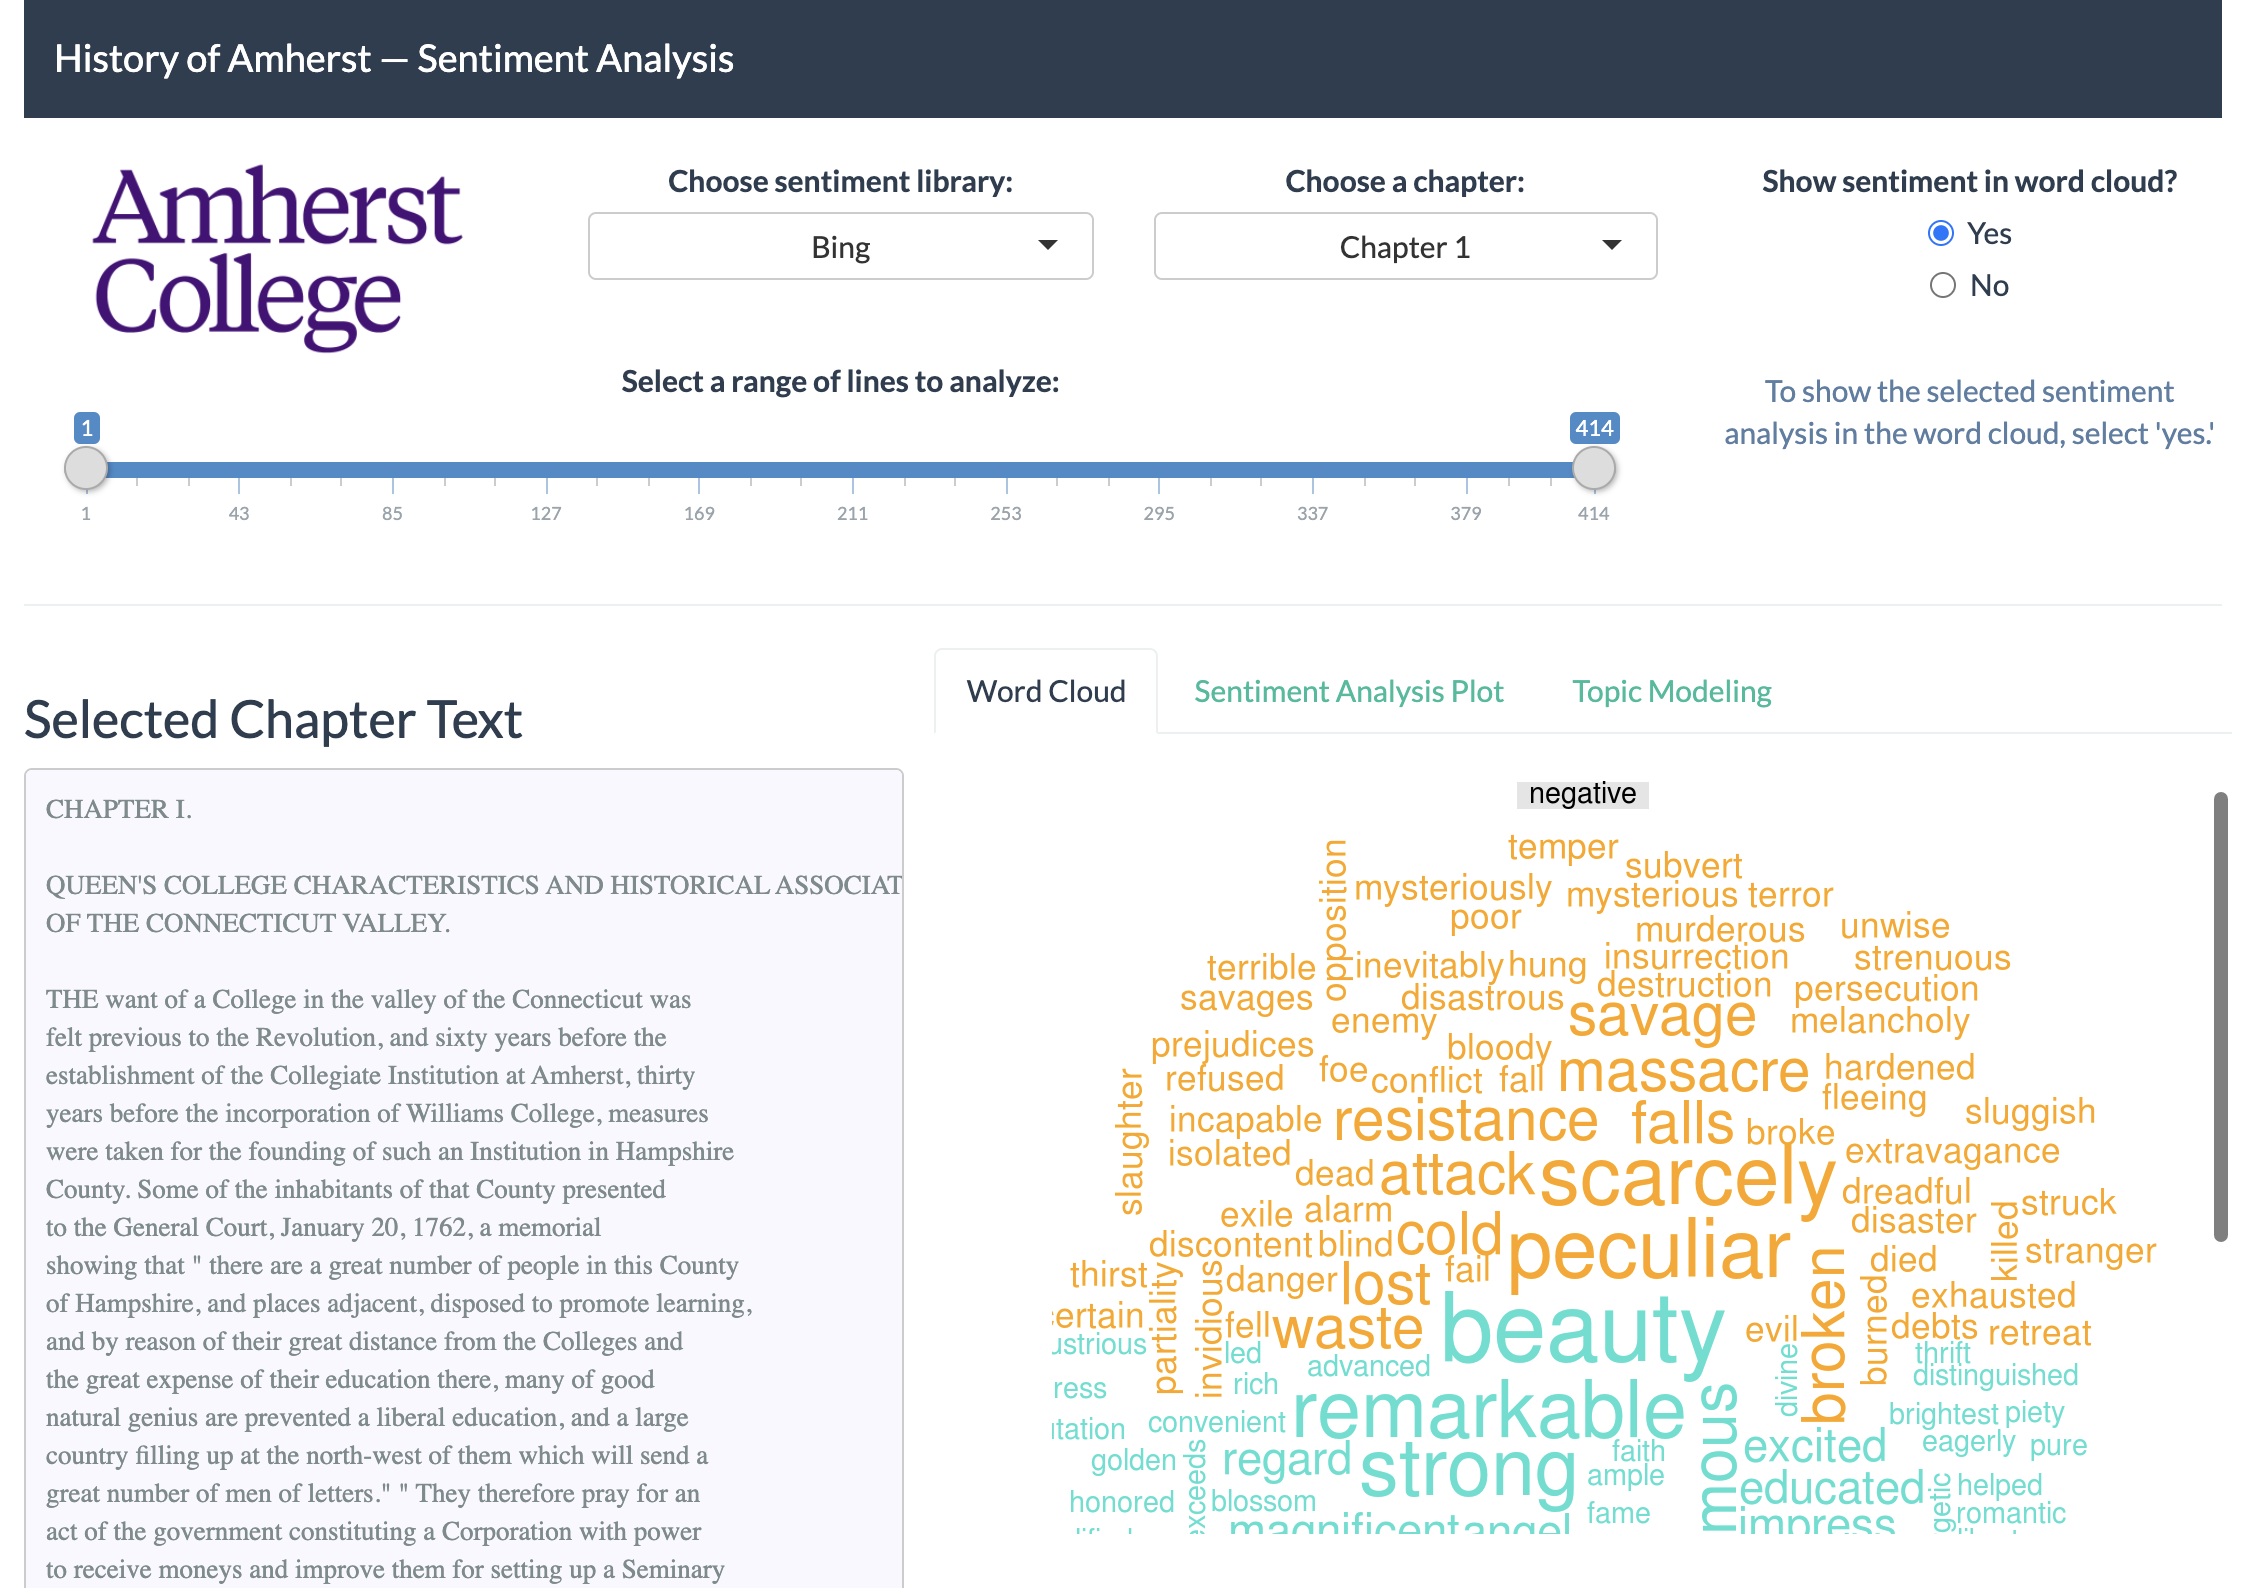
Sentiment Analysis Shiny App
An R Shiny app created to visualize sentiment analysis and topic modeling of the book “History of Amherst College during the First Half Century”.
COVID Race Data — R Package
An R Package containing two (wrangled) datasets on the COVID-19 pandemic in the US by race/ethnicity (as of 10/07/2020). More specifically, it has data for the number of COVID-19 cases and deaths by race/ethnicity for each state.
The raw data used to wrangle the datasets in this R package was obtained from The COVID Tracking Project.
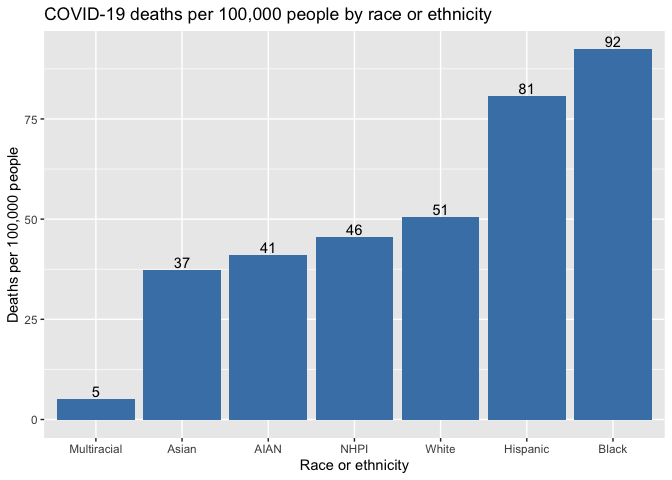
An example visualization I created using the data in this package.
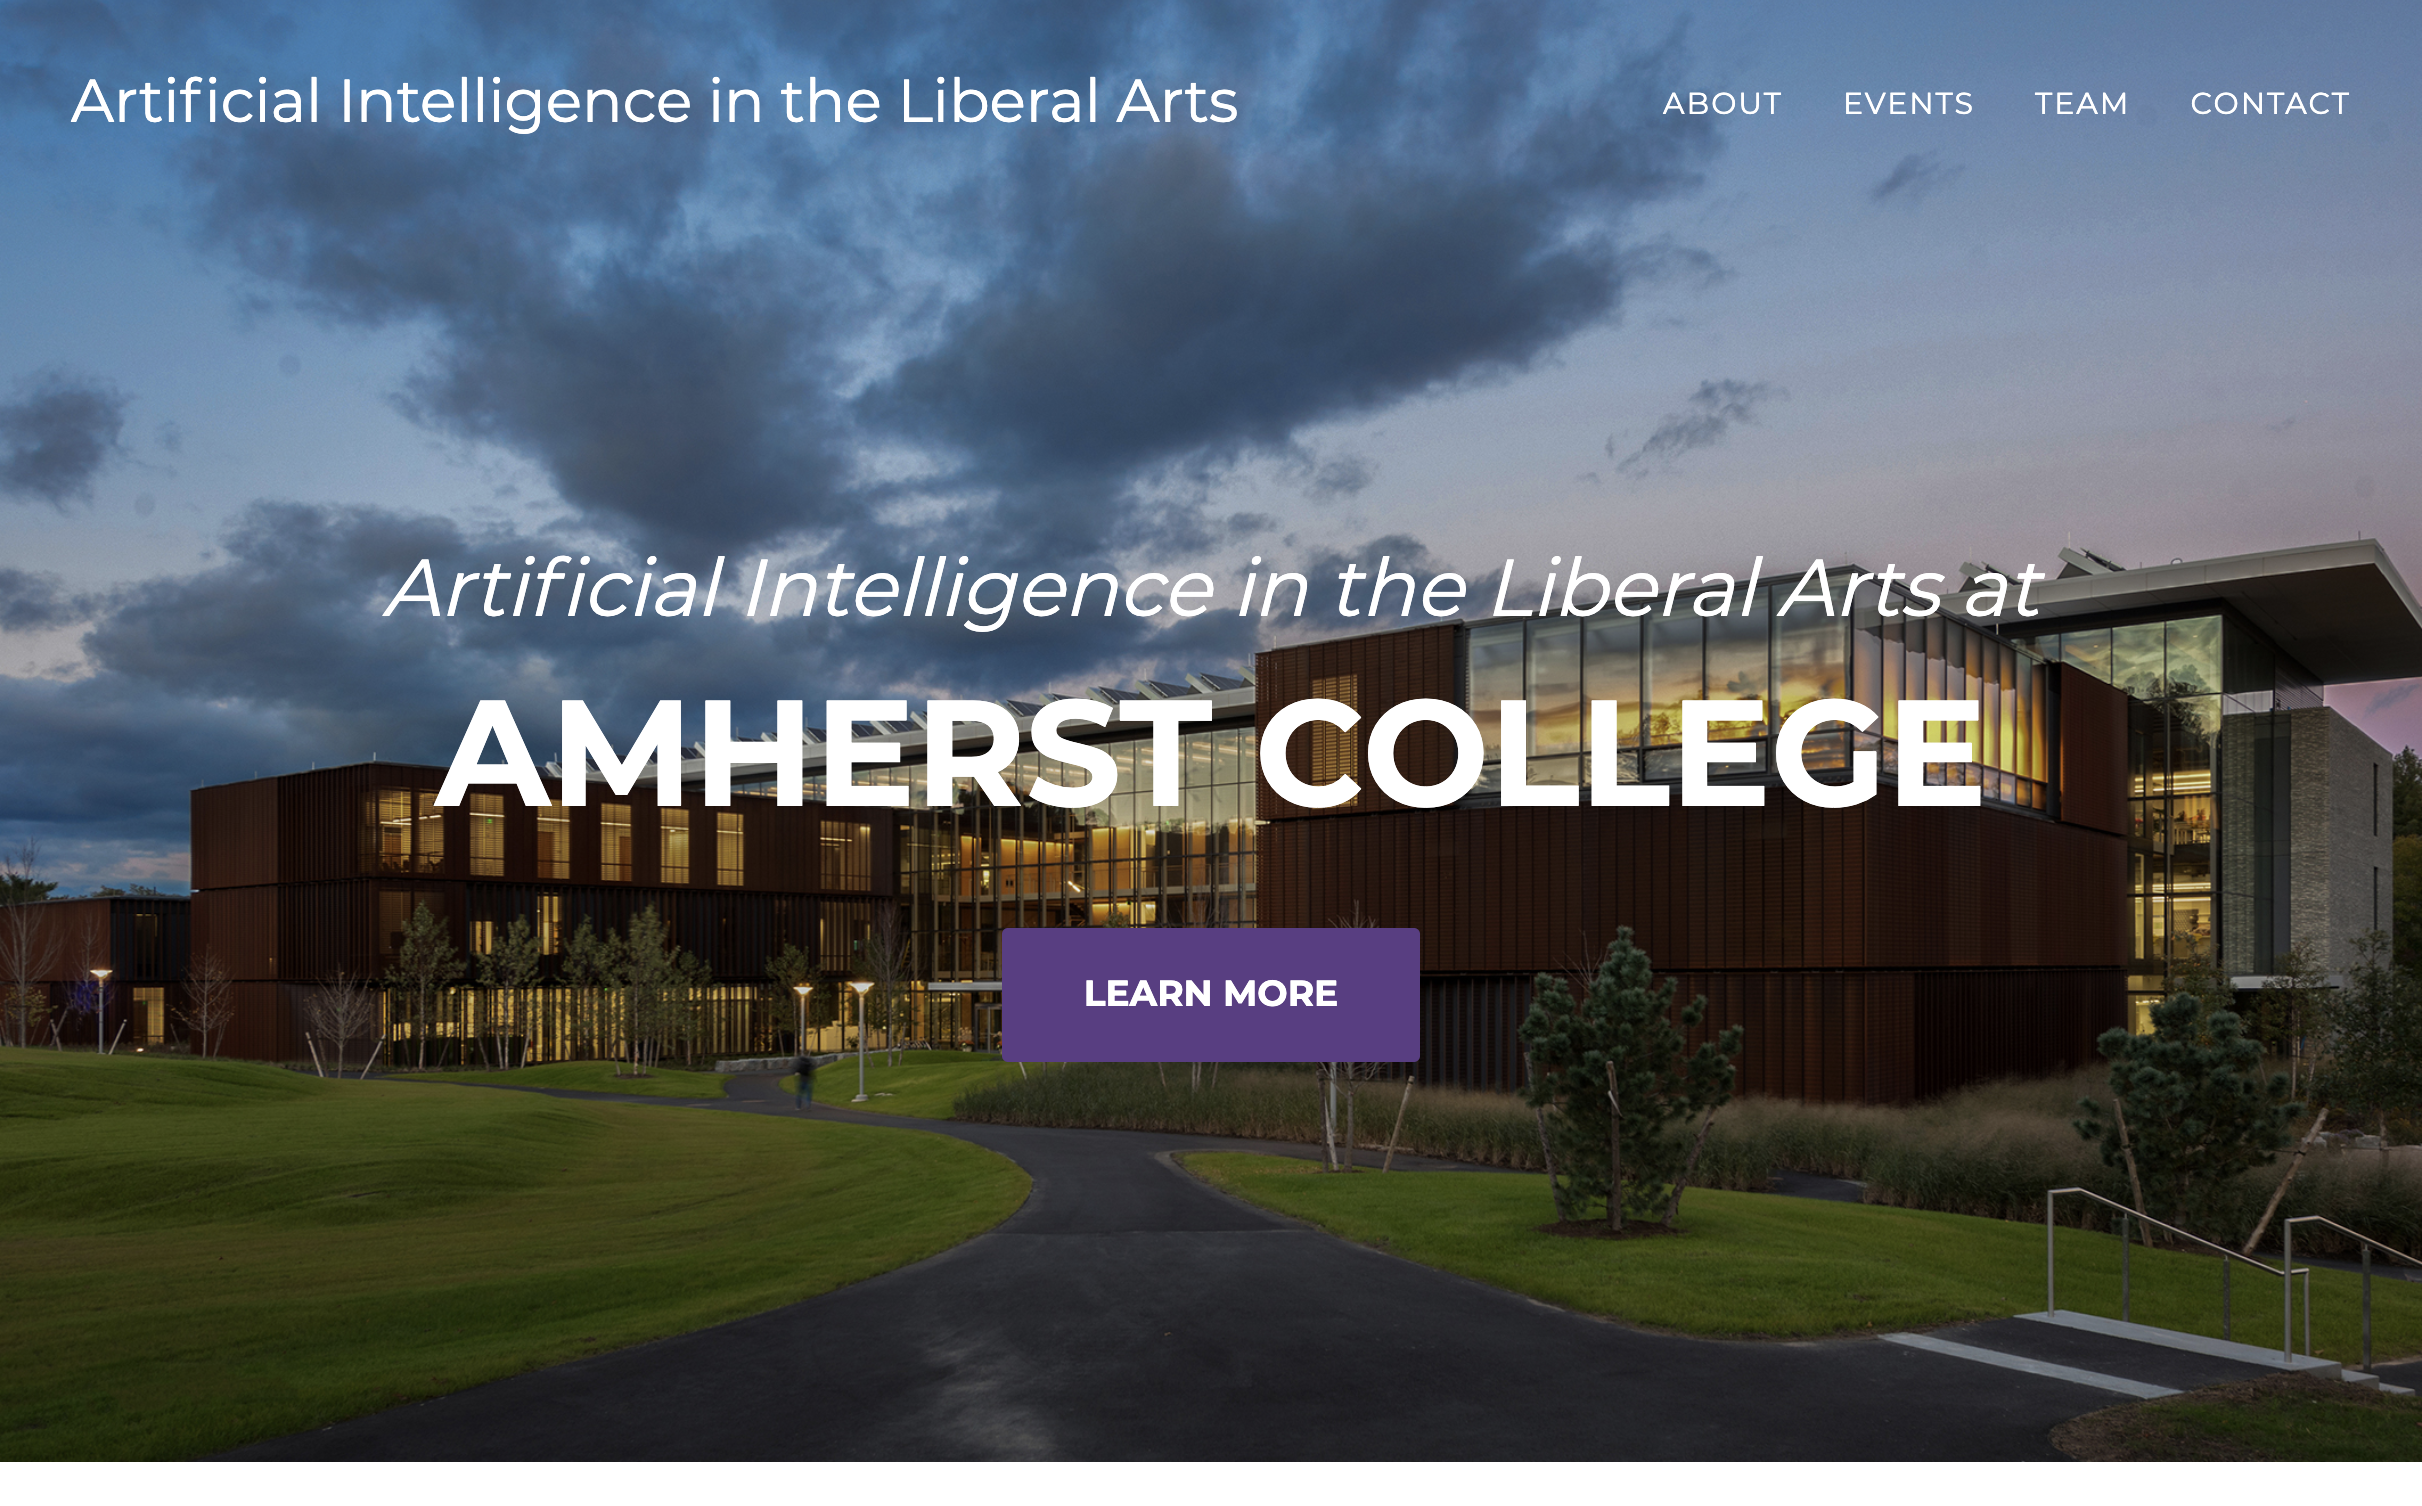
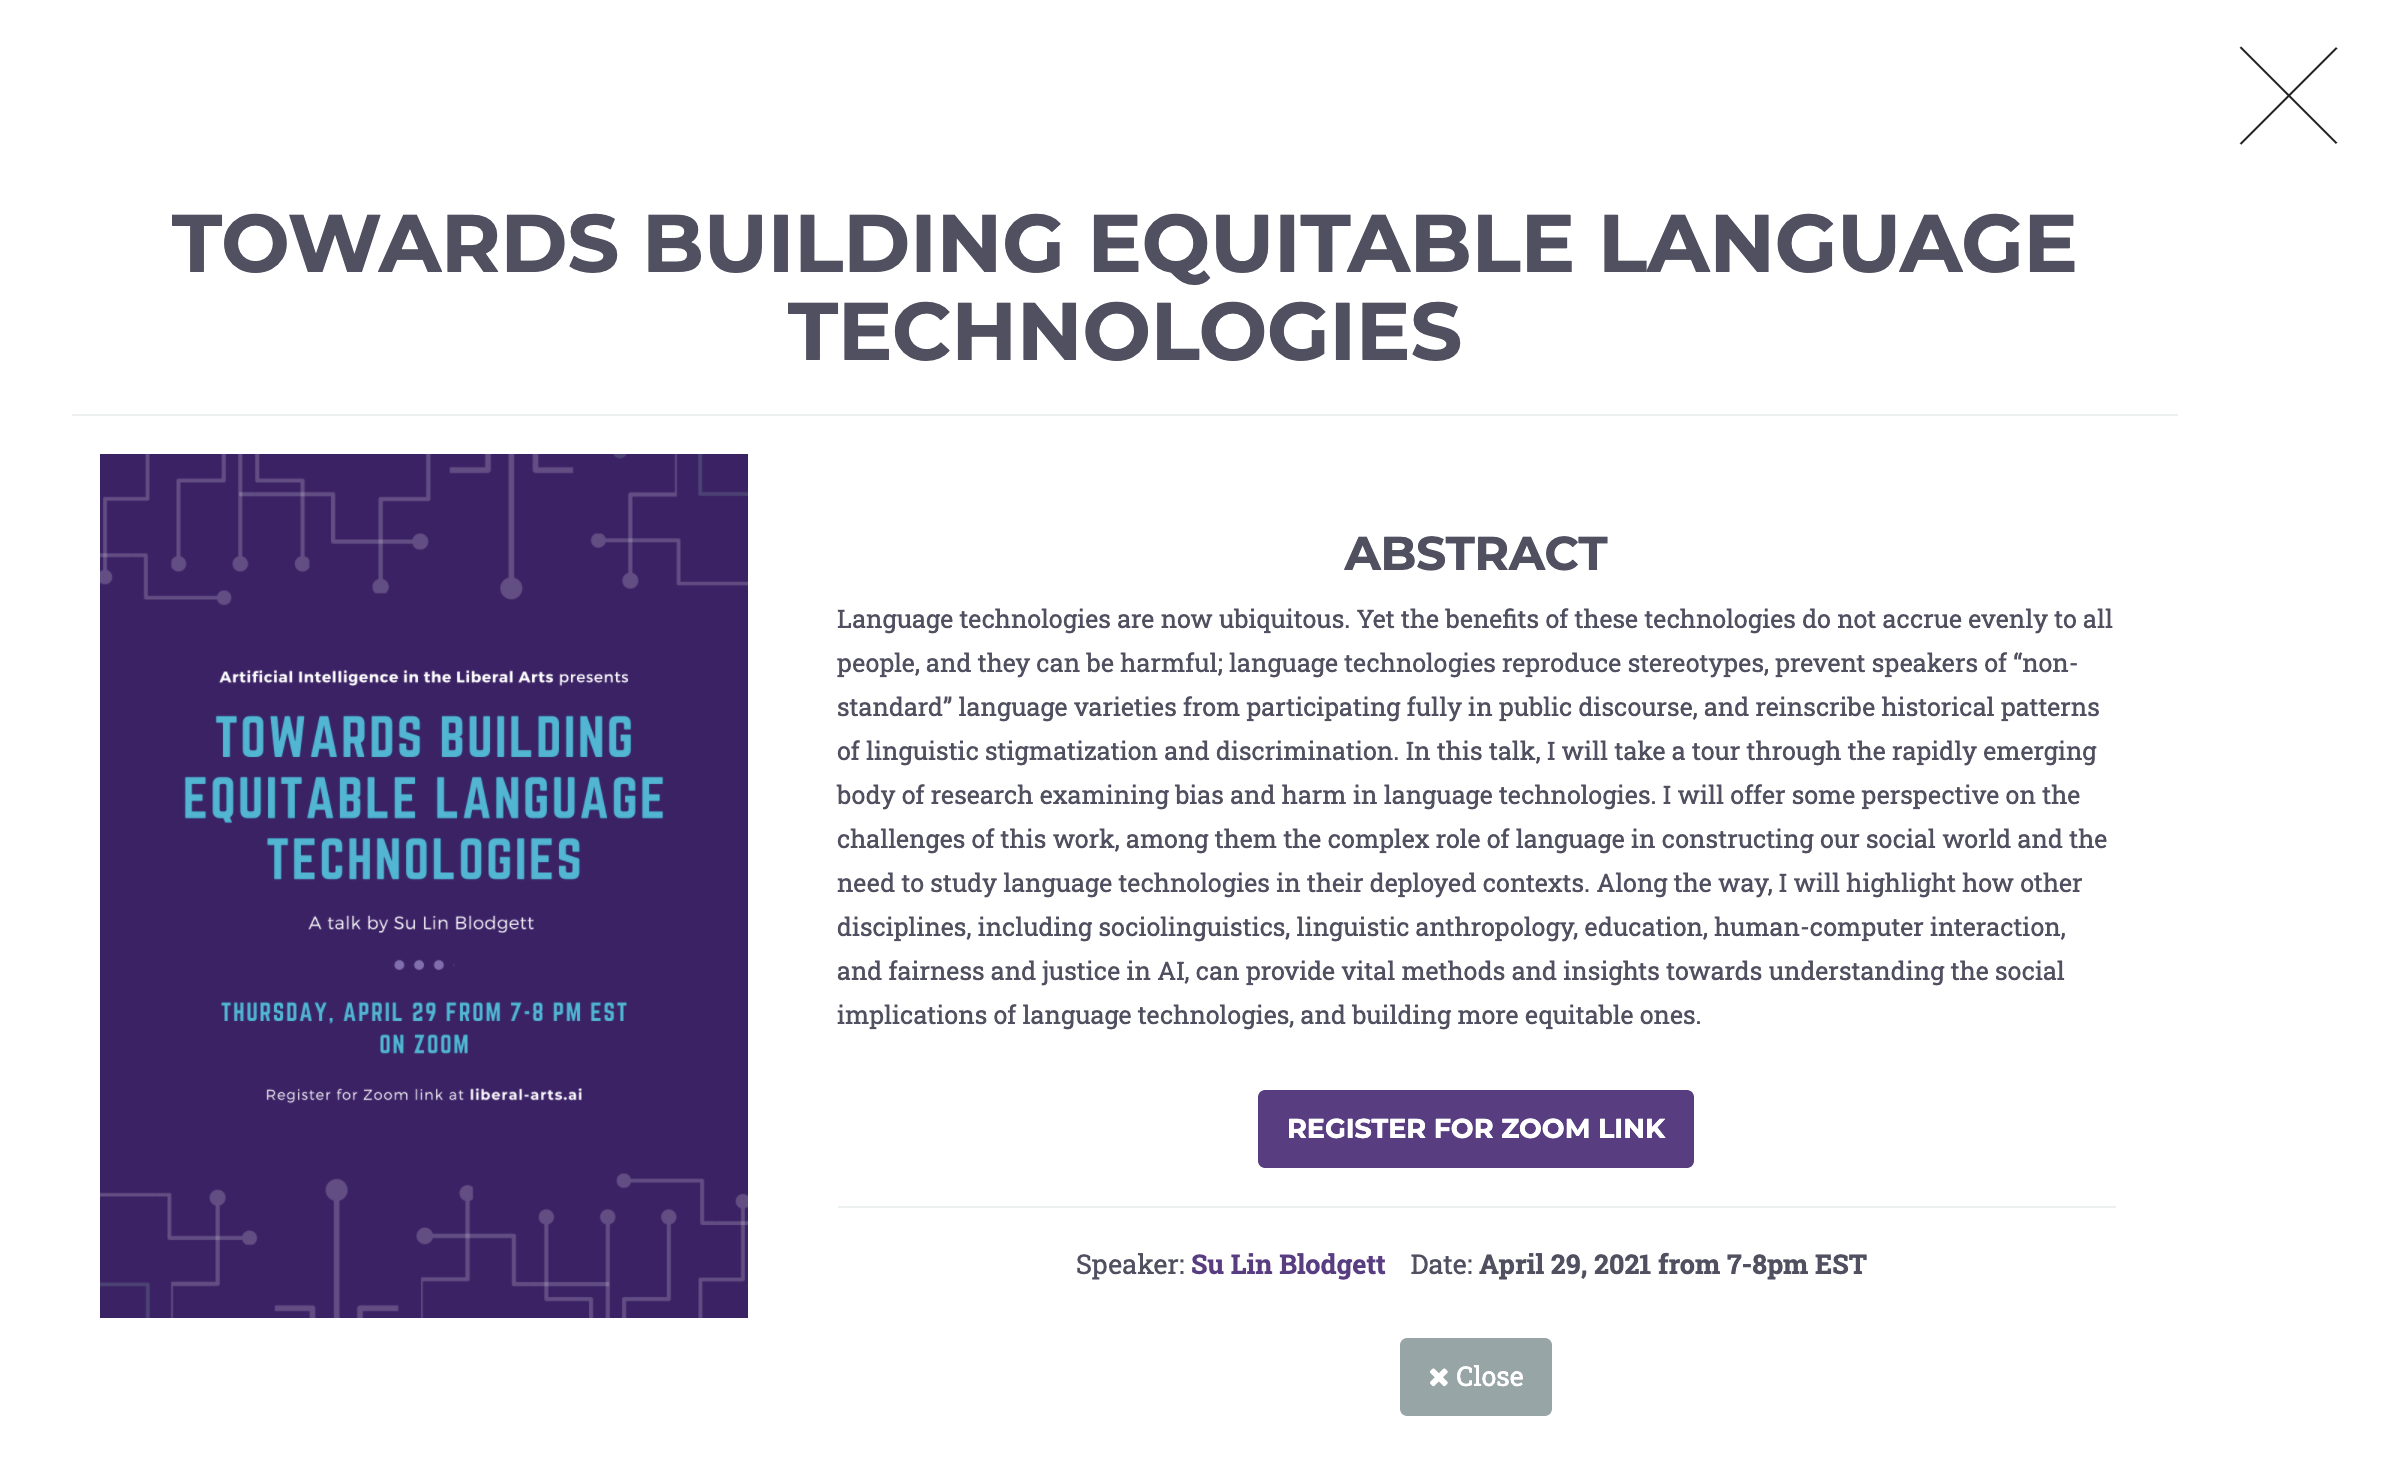
Artificial Intelligence in the Liberal Arts Initiative Website
A static website I created using Jekyll for the AILA initiative at Amherst College. I adapted an existing Jekyll template to the needs of the initiative and dealt with all aspects of the site from designing posters to creating custom layouts for events.
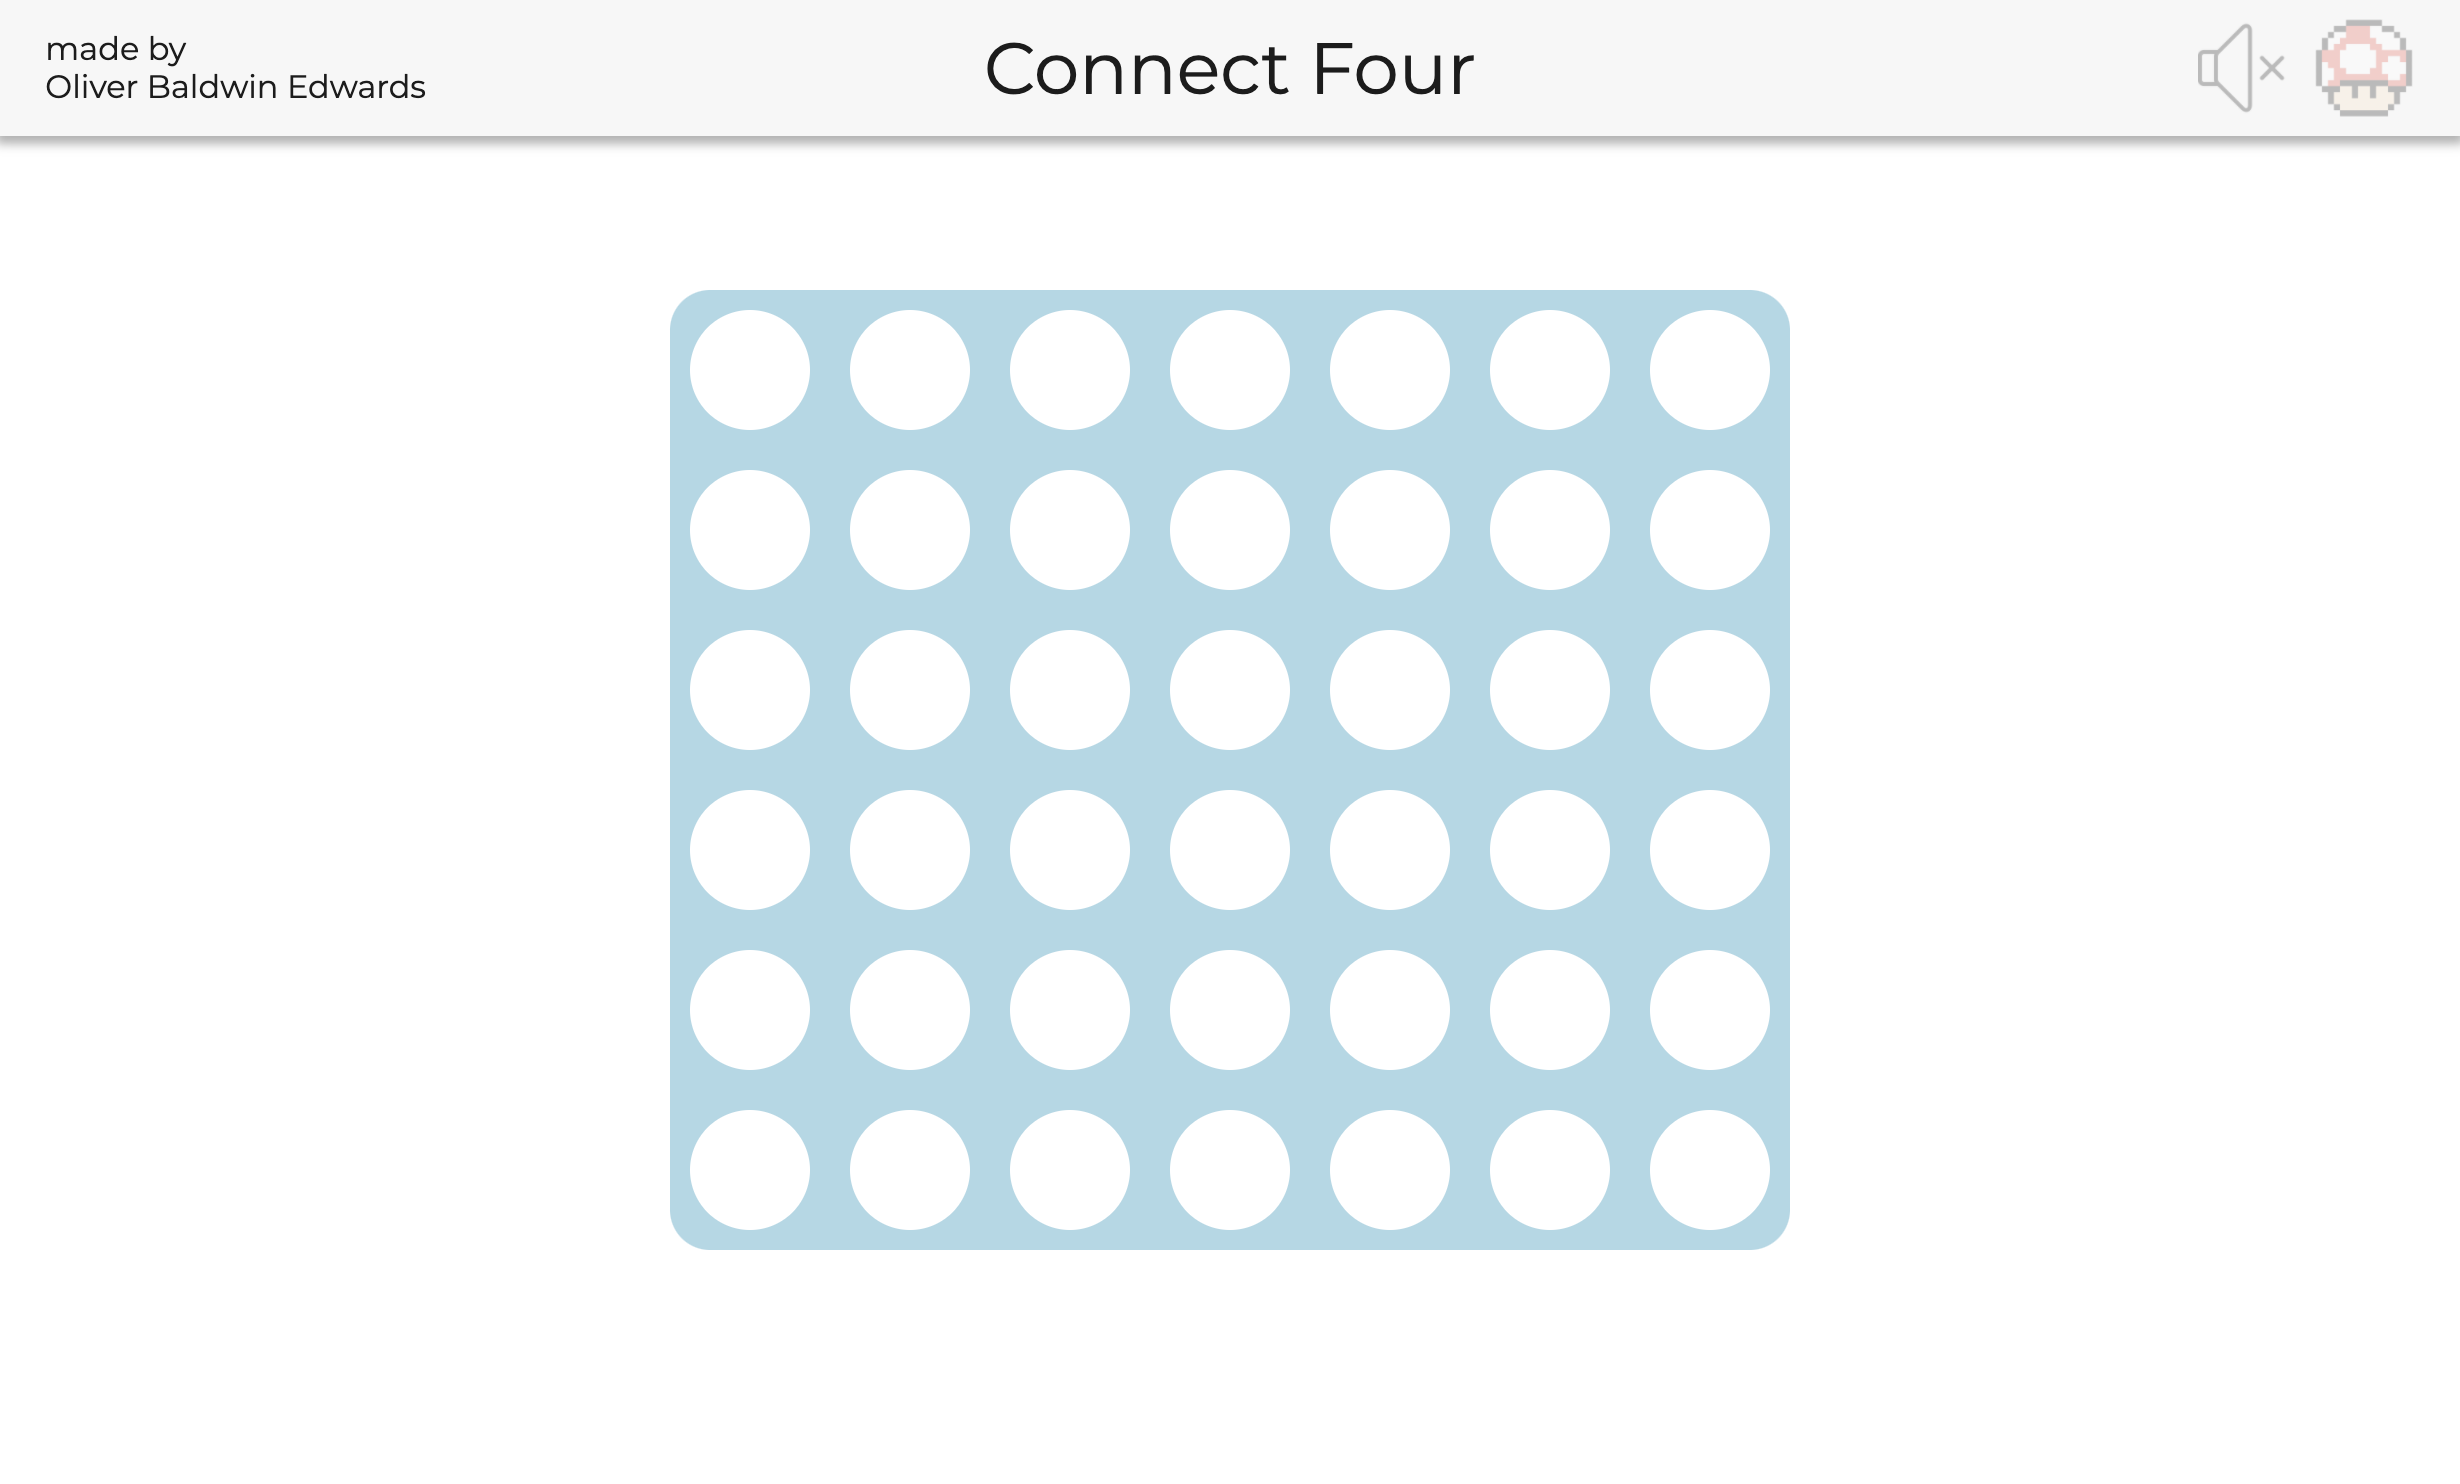
Connect Four
A JS/CSS/HTML implementation of Connect Four written from scratch as a way to help teach myself web development.
Technical Skills
Proficient in:
- Python, Java, R, Git
Meaningful experience with:
- JavaScript, C++, Clojure, HTML, CSS, R Shiny Apps
Exposure to:
- SQL, C